Key Takeaways:
- Segmented Market View: Markets operate as diverse segments rather than simple binary on-off switches.
- Metric-Based Visualization: New graph plots total active products against yearly implementations to reveal trends.
- Economic Leverage Shifts: Market maturity within specific segments dictates the pricing power for institutional deals.
In the world of EdTech, “saturation” is a word that gets thrown around constantly. You’ve heard the refrains in boardrooms and at conferences: “That category is saturated,” “There’s no more room to grow,” or “Everyone already has a solution.”
The problem? Most of these conversations happen at the surface level. We treat market saturation like a light switch—it’s either on or off. But markets aren’t binary; they are segmented. And once you pull back the curtain on those segments, the “saturation” story often falls apart.
At ListEdTech, we’ve just released a new graph in our portal designed to change how you see the market. By shifting the perspective, we can see exactly where a market is maturing and where the “land grab” is still very much alive.
The Problem with “the Market”
When we look at a category like K–12 Student Information Systems (SIS) as a single monolith, we miss the nuances that drive strategy. To truly understand a market, you have to compare two specific metrics over time:
- Total institutions with an active product (The X-axis: Market Breadth)
- Total implementations (new + upgrade) per year (The Y-axis: Market Velocity)
When you plot these against each other, you stop asking “Is this market saturated?” and start asking, “Which segment is saturated—and which isn’t?”
Case Study: Large vs. Small Institutions
The difference in market reality becomes clear when we segment by institutional size.
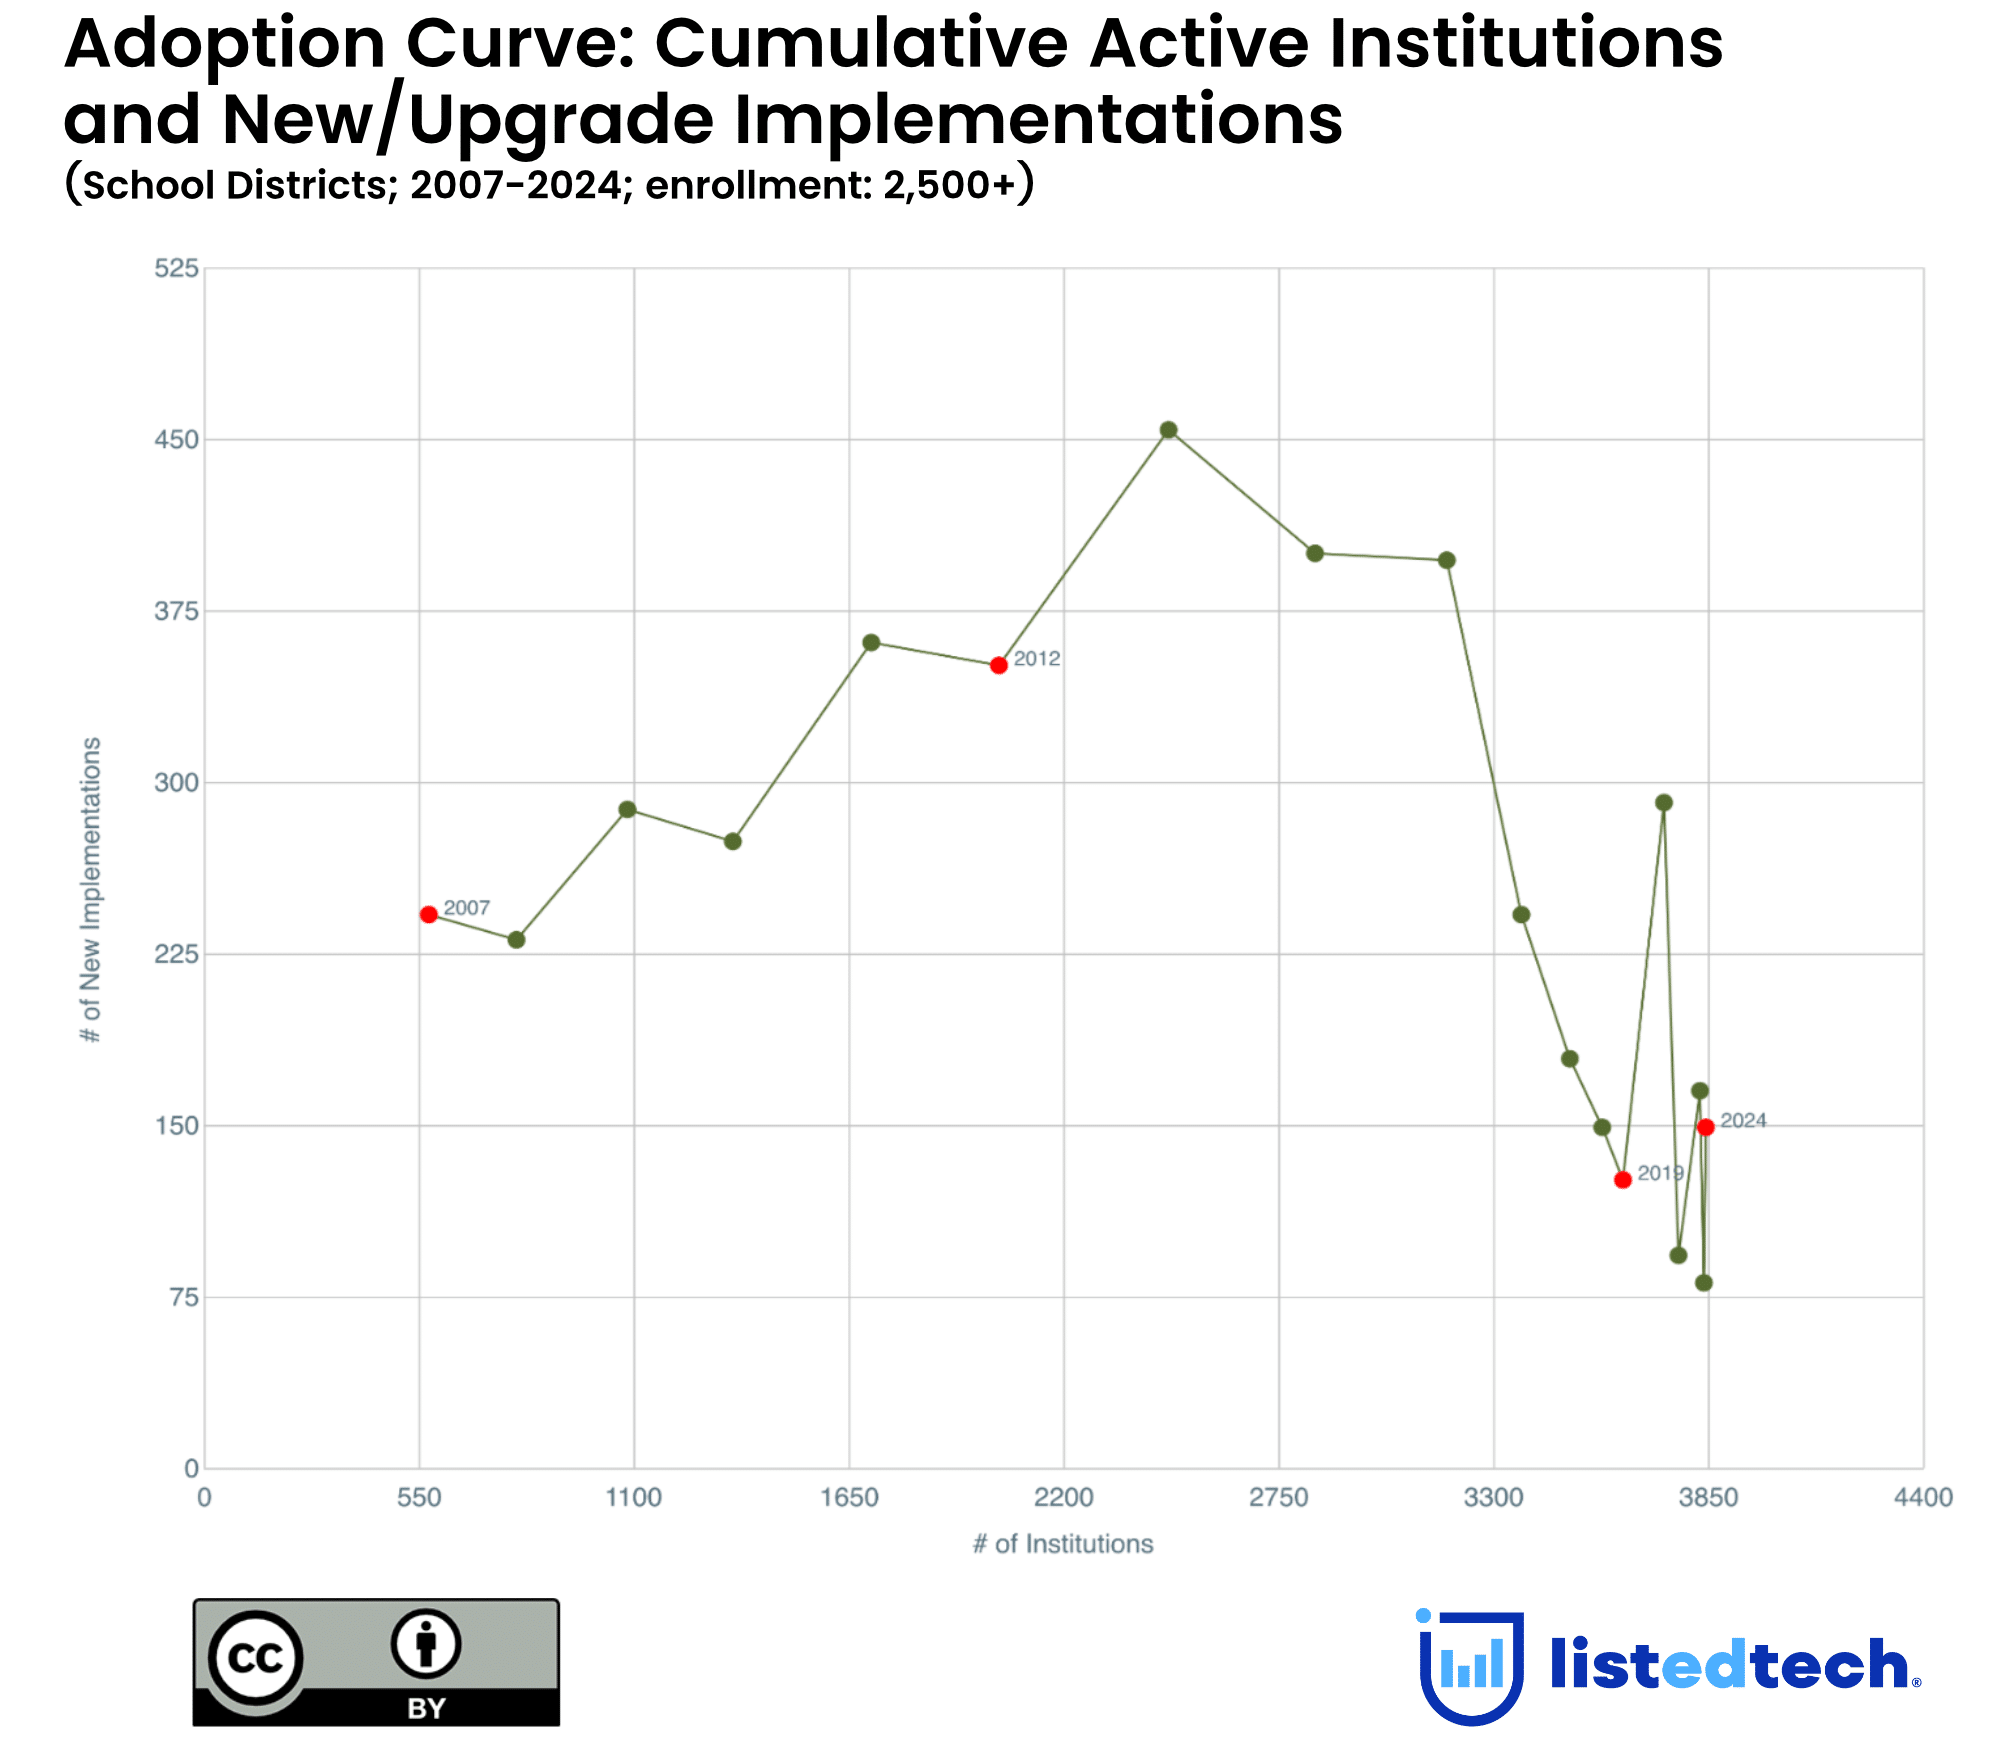
1. Large Institutions: The Mature Landscape

In the large-institution segment for SIS, the graph tells a story of maturity. The number of institutions with an active product has stalled (the data point stops moving right on the X-axis). New implementations have flattened. In this world, growth is almost entirely a “replacement game.” It’s a battle for displacement, not discovery.
2. Small Institutions: The Expansion Frontier
Now, look at the graph for smaller institutions in the same category.
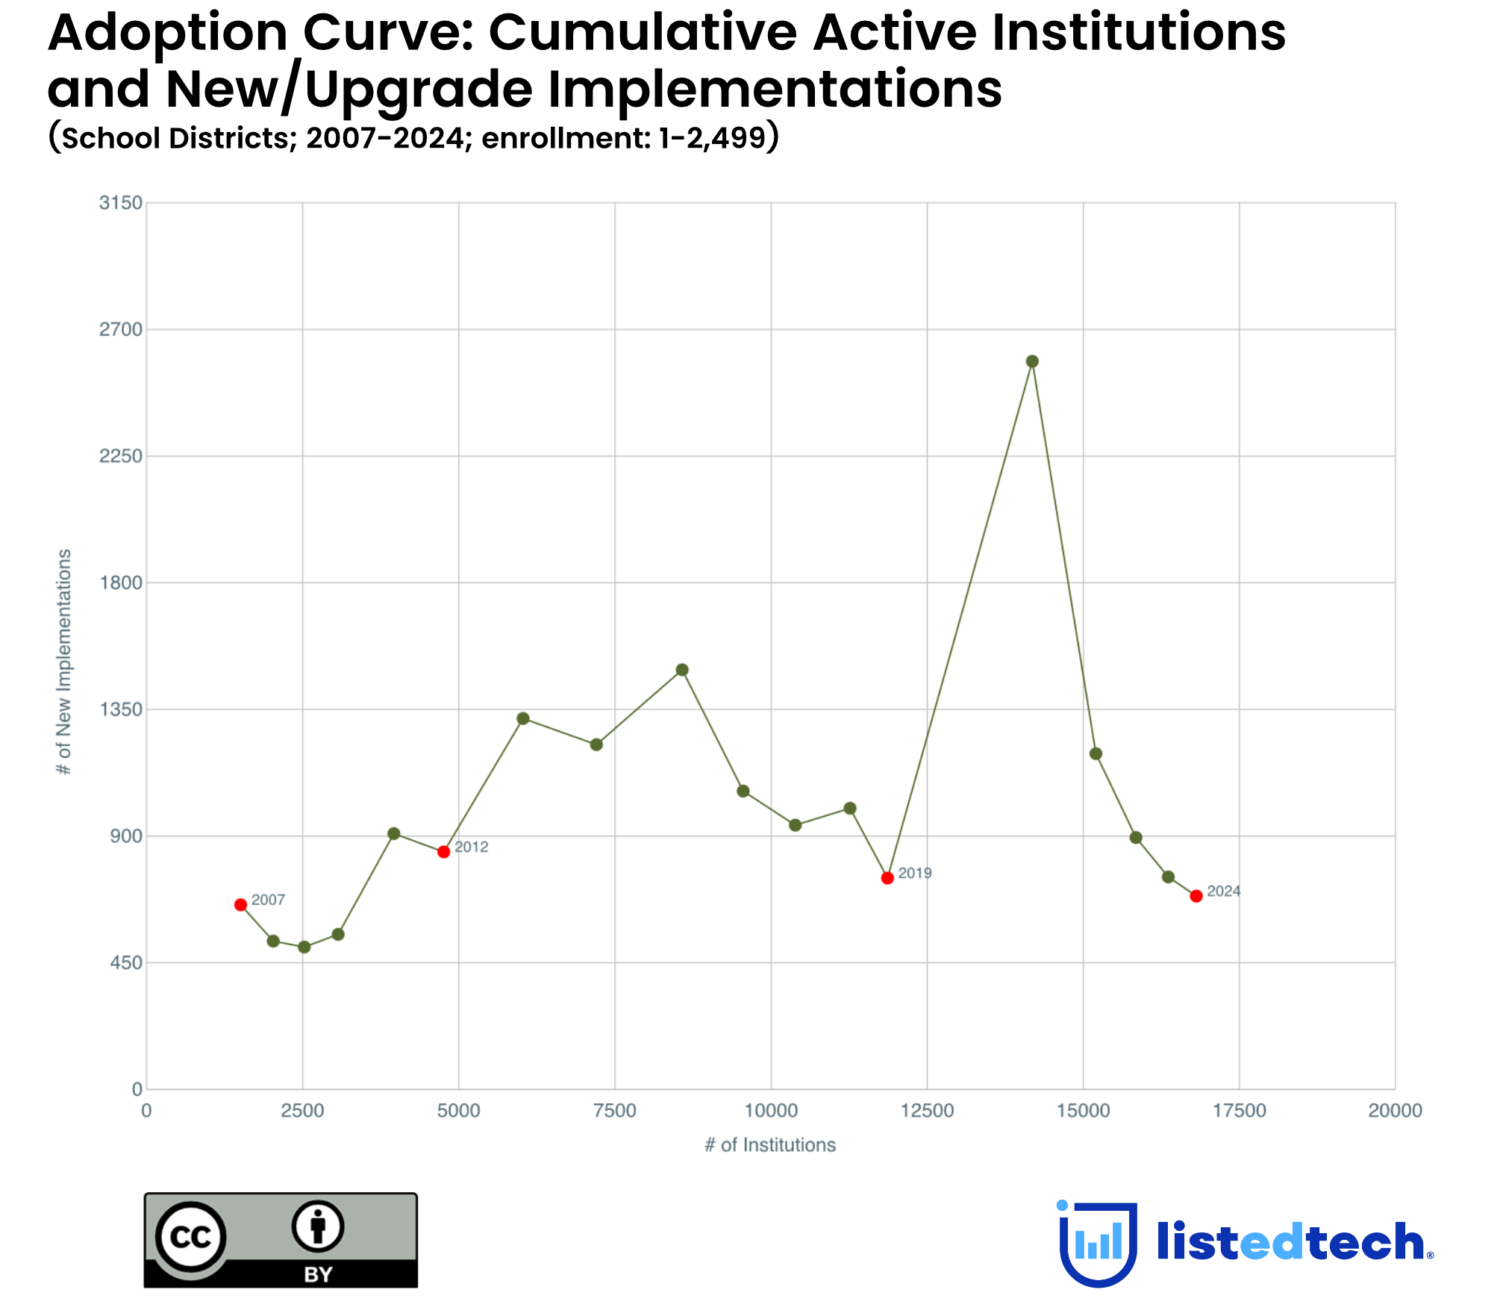
This is a completely different curve. Unlike the large-scale segment, the total number of institutions with active systems is steadily climbing—increasing by roughly 500 new institutions every year. The implementation momentum is sustained.
It’s the same product category, but a completely different market reality.
Why Saturation Dictates Pricing Power
This isn’t just an academic exercise in data visualization; it has massive implications for your bottom line. Saturation fundamentally shifts the “leverage” in a deal.
In Saturated Segments:
- The Displacement Game: Since most institutions already have a system, vendors are fighting to kick a competitor out.
- Retention is King: Growth slows, making every existing contract precious.
- Buyer Leverage: Institutions often have more room to negotiate, especially during renewal or replacement cycles, because vendors are desperate to avoid churn and need “displacement wins.”
In Expanding Segments:
- The Adoption Game: Adoption curves are still climbing, and many buyers are looking for their first modern solution.
- Vendor Leverage: In these high-growth areas, vendors typically maintain stronger pricing power because the demand for “net-new” implementations remains high.
The takeaway: Pricing power follows market structure. You shouldn’t ask if the category is saturated; you must ask if your specific segment is.
What This Means for Your Strategy
Whether you are selling, investing, or buying, this segmented view of saturation should change your behavior:
- For Vendors: This data highlights the importance of viewing the market at a segment level rather than as a monolith. While overall headlines may suggest maturity, certain segments may still be in active expansion, with continued opportunity for focused sales investment.
- For Investors: The data can help distinguish between churn-driven change and true expansion. Categories often labeled as “mature” may still contain high-growth segments with meaningful investment potential.
- For Institutions: Understanding market structure can clarify relative leverage. In mature, displacement-heavy markets, this insight can inform positioning and support more favorable outcomes during contract negotiations.
Last fall, we published a blog post about rethinking how we define saturation. This new graph is that idea in action. When you segment properly, you realize that what looks “done” on the surface is often just getting started.
That’s where the opportunity, and the leverage, lives.