Key Takeaways:
- Saturation is dynamic: True market health is revealed by combining adoption and implementation data.
- Markets behave differently: Conferencing is stable, LMS is replacement-driven, SIS is cyclical.
- Better strategy: Clearer metrics guide vendors, investors, and institutions toward smarter decisions.
Market saturation is a concept we often discuss at ListEdTech because it comes up frequently with our clients. Investors want to know if a market still has room to grow, while startups want to understand whether they are entering a space with opportunities or one that is already crowded. Last year, we explored saturation by looking at the percentage of institutions that had adopted specific product categories. That approach highlighted when a market reached near-total adoption — essentially, when very few institutions were left to adopt a given system.
This year, I want to revisit this concept with a fresh lens. Instead of only looking at how many institutions use a product group, I’m combining that with new implementations per year. This creates a more dynamic picture: not just who has a system today, but how adoption momentum has changed over time.
Market Saturation for Conferencing, LMS and SIS

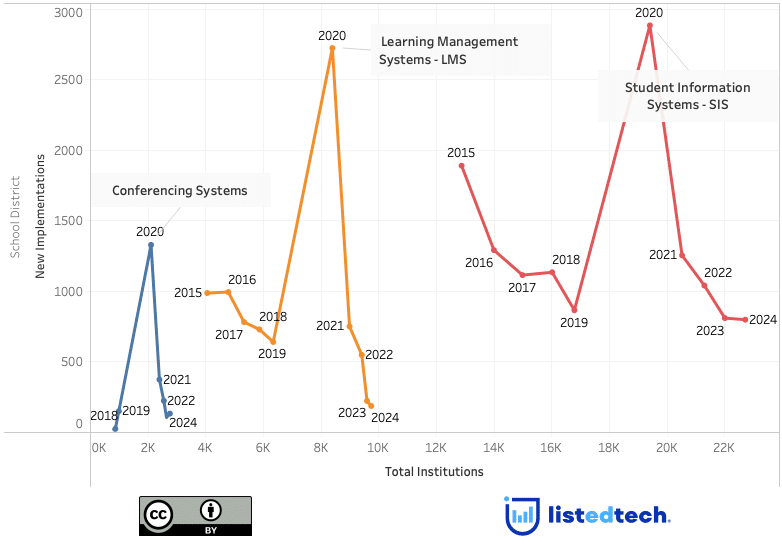
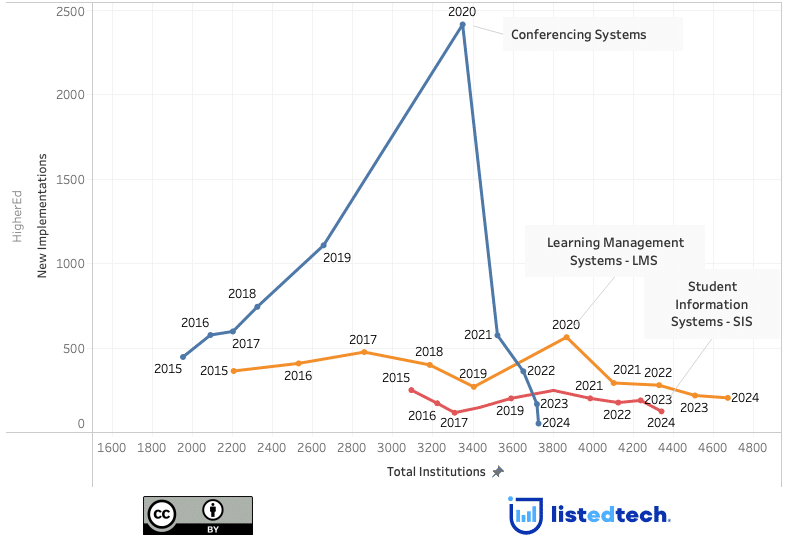
Chart Overview: Understanding the Axes
- Y-axis (New Implementations): Shows how many institutions adopted a system in a given year. A spike may indicate external shocks (e.g., conferencing systems in 2020 during COVID) or vendor-driven change (e.g., a major end-of-life announcement).
- X-axis (Total Institutions): Tracks how many institutions in total are using a given product group. If the number of total institutions flattens while new implementations remain high, that means we’re seeing replacement activity, not true market expansion.
This is the core of identifying market saturation:
- If the growth in total institutions slows, the market is saturated.
- If there are many new implementations but little movement on the total-institutions axis, then institutions are just switching systems, not expanding adoption.
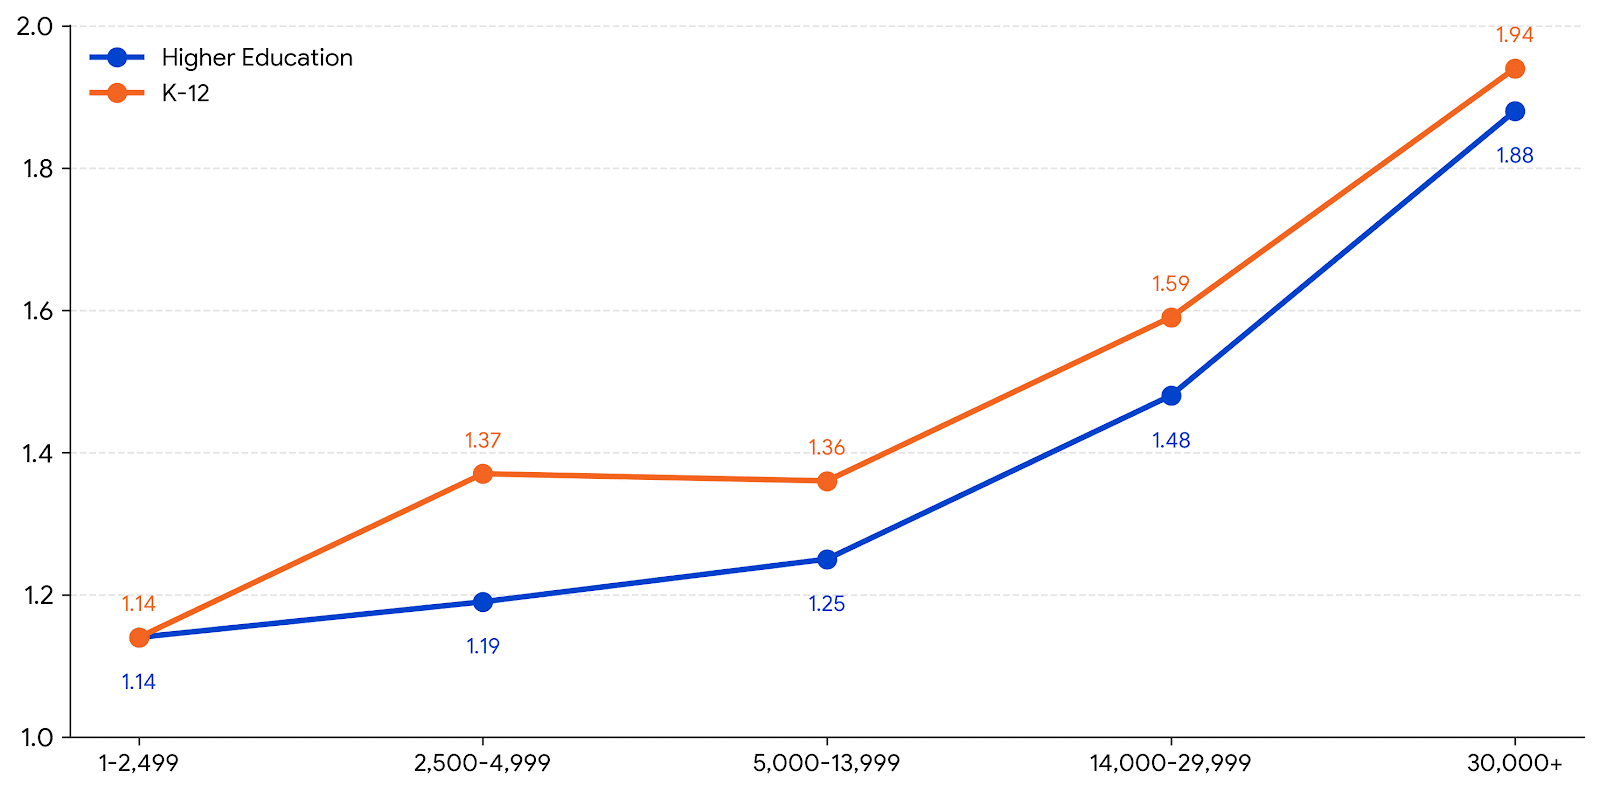
A Possible Formula for Saturation
Let’s quantify this relationship. For example:
- If the total number of new implementations in a year is more than twice the number of added “total institutions”, that’s a strong signal of saturation.
- Example: 1,000 new implementations in a year, but only 400 additional institutions show up in the total count. That means at least 600 were replacements, not new adoptions. This market is therefore saturated and we may now call it a replacement market.
This saturation ratio helps separate growth markets from replacement markets.
What the Data Tells Us
School Districts:
- Conferencing Systems skyrocketed in 2020 due to the COVID-19 pandemic but plateaued quickly after. The adoption nearly saturated overnight.
- LMS usage still expands, but the slowing movement on the X-axis suggests we’re entering a saturated market. Like the Conferencing Systems, the very few institutions without an LMS implemented one around 2020 to support distance learning. Since then, institutions mostly replaced their systems due to faculty retraining, course rebuilds, and governance hurdles.
- SIS systems remain essential. Among the necessary IT systems, SIS are one of the first to be implemented in any given institutions. SIS replacements occur in rare, synchronized waves driven by regulatory pressure, vendor timelines, and institutional modernization initiatives, since changing a SIS disrupts core administrative processes and requires major cross-campus coordination. Nowadays, most school districts have an SIS and this market is in replacement phase.
Higher Education:
- Conferencing systems experienced the same pandemic-driven spike as in K-12: adoption surged almost universally in 2020 to support remote teaching and meetings. Almost every institution adopted at least one platform, and many standardized on a single tool to reduce support complexity.
- LMS adoption continues to grow modestly, but momentum is slowing. Most colleges and universities already had an LMS before 2020, but the pandemic cemented its centrality to pedagogy. Since then, the main driver of new implementations has been vendor replacement rather than first-time adoption, as institutions seek better integration, analytics, or cloud hosting.
- Student Information Systems have been saturated for decades in HigherEd — every institution relies on one to run admissions, registration, and reporting. Growth occurs only through replacements, which happen in waves when institutions modernize (e.g., move to cloud) or respond to vendor end-of-life announcements. Because replacing a SIS touches nearly every office, these projects are high-cost, multi-year efforts, which is why we see episodic spikes in implementation rather than steady growth.
Why This Matters
By combining adoption momentum (Y-axis) and market coverage (X-axis), we can clearly distinguish mature, growth, and shock markets, helping stakeholders see not just whether a market is saturated, but how it reached that state. This perspective reveals that conferencing systems are now stable, LMS adoption is largely driven by vendor replacements, and SIS replacements occur in predictable modernization waves. The proposed saturation ratio sharpens this view by quantifying the balance between true growth and churn. Together, these insights guide vendors in refining their messaging, investors in targeting real opportunities, and institutions in preparing for upcoming upgrade cycles. This approach doesn’t just tell us whether a market is saturated, it shows how it got there.